
树莓派温度、内存、cpu、硬盘监控
一、前因
每次连接树莓派都不自觉地输入 htop 查看用了多少内存,df -h 查看用了多少空间,今天想着或许可以找款工具,替代下我这下意识的举动,搜寻一番,原来早已有一款专门为树莓派设计的工具了。
用了一下,还挺强大,使用说明在这:https://xavierberger.github.io/RPi-Monitor-docs/10_index.html
二、安装
这次就不用docker-compose安装了,挂载一大堆路径,远没有直接安装来的快。
官网的安装步骤太古老了,而且有些还没反应(你懂的),下面是改造的安装办法,只是换了条路而已,本质还是一样的。
添加rpimonitor源
apt install apt-transport-https ca-certificates dirmngr
apt-key adv --recv-keys --keyserver keyserver.ubuntu.com 2C0D3C0F
wget https://raw.githubusercontent.com/XavierBerger/RPi-Monitor/master/src/etc/apt/sources.list.d/rpimonitor.list -O /etc/apt/sources.list.d/rpimonitor.list
安装并升级RPi-Monitor
apt update && apt install rpimonitor && apt upgrade -y
添加源如果出现下面错误
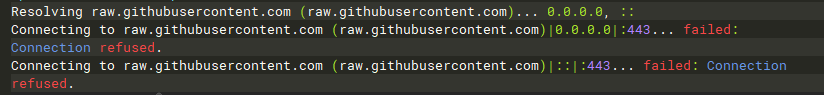
进入这里:https://www.ipaddress.com 解析 raw.githubusercontent.com 的IP。
我这里解析出来四个,全部添加入hosts就行。
运行下面代码,添加hosts。
sed -i '$a185.199.108.133 raw.githubusercontent.com' /etc/hosts
sed -i '$a185.199.109.133 raw.githubusercontent.com' /etc/hosts
sed -i '$a185.199.110.133 raw.githubusercontent.com' /etc/hosts
sed -i '$a185.199.111.133 raw.githubusercontent.com' /etc/hosts
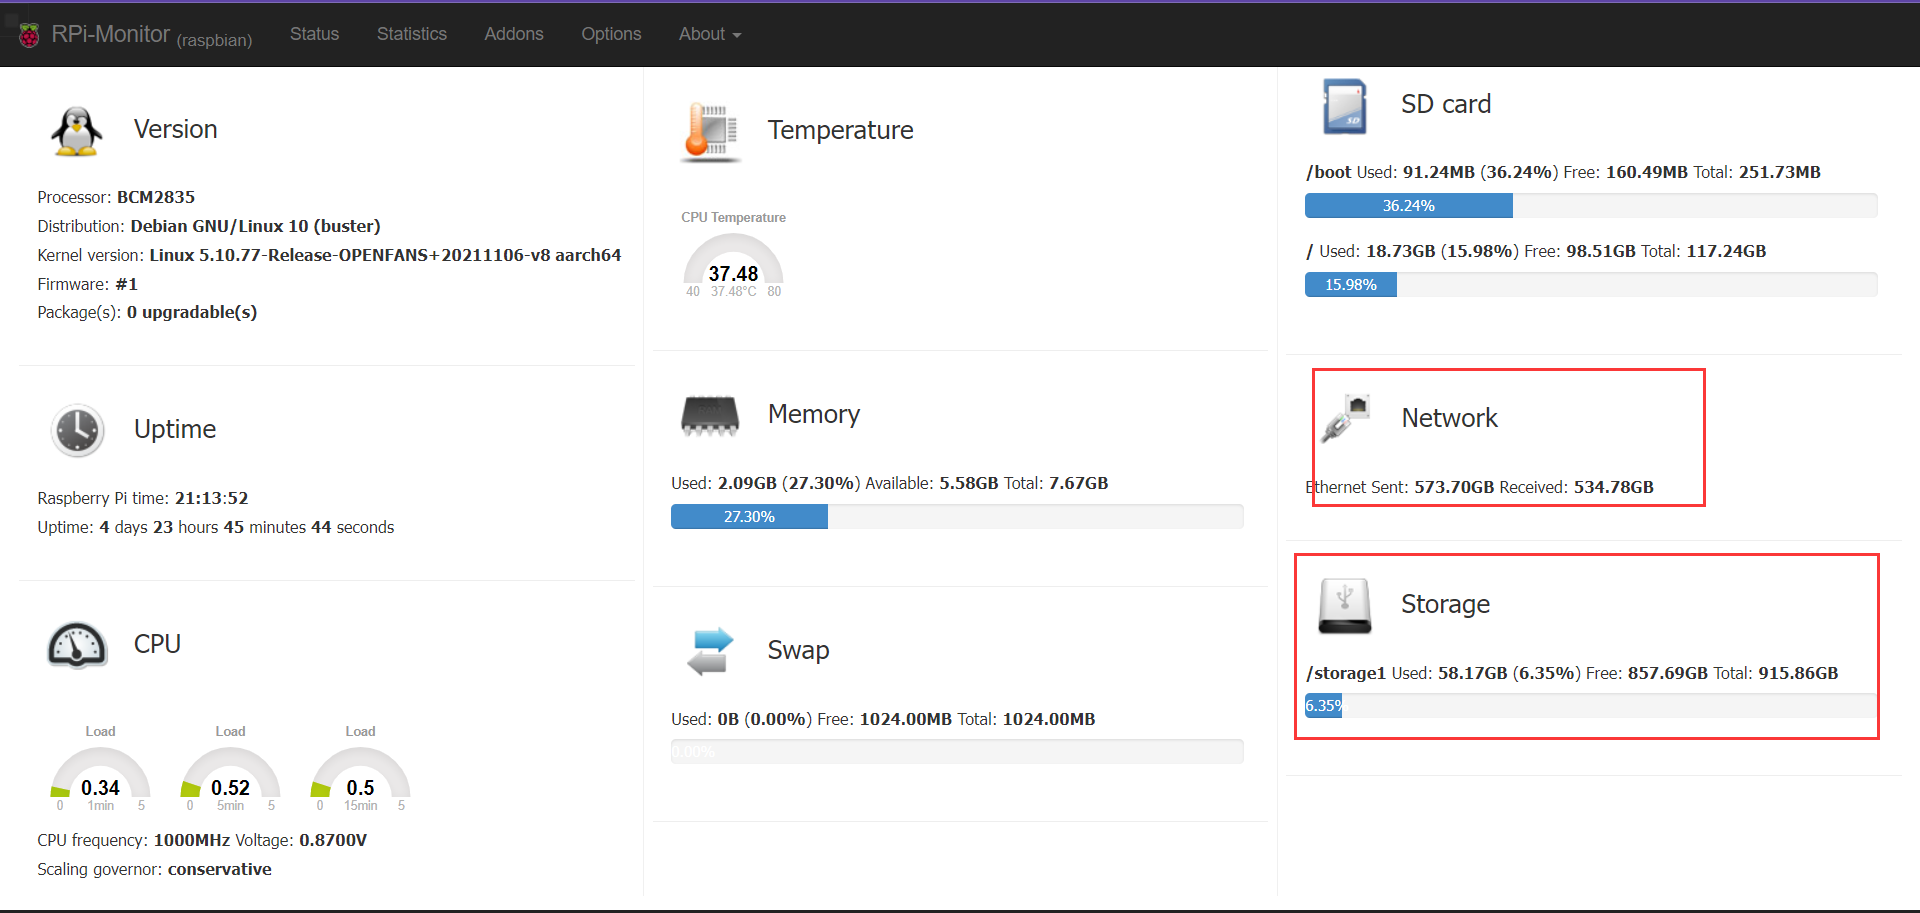
输入树莓派IP+8888就可以进入页面,它长这样。
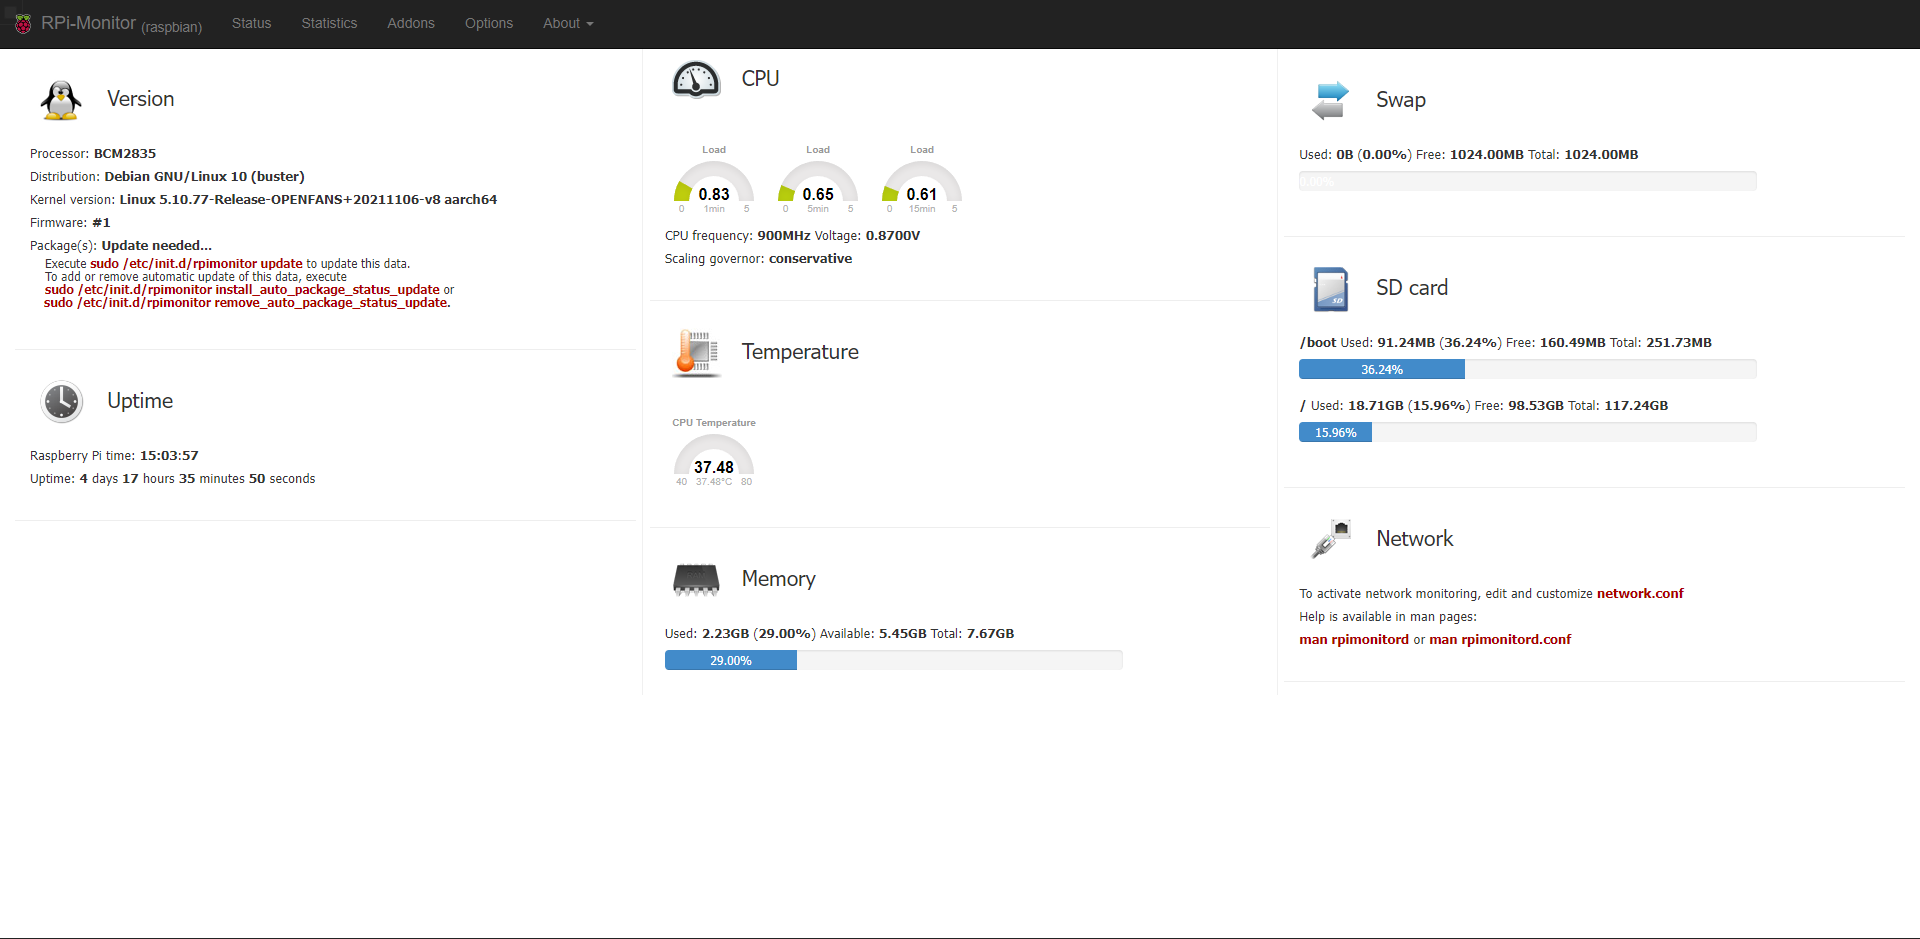
有红色警告,我们去升级一下。
sudo /etc/init.d/rpimonitor update
三、优化
我们看到外接的硬盘没在里面,而且网络监控也没有配置,rpimonitor共有三处配置地点,位置在 /etc/rpimonitor ,如下图:
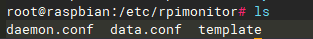
daemon.conf : 配置网页端口,日志等 data.conf : 总配置文件 template : 模板文件,里面预置了许多配置文件,我们只需要进去放开注释,修改成自己的即可
我这里只做了network 与 storage 的修改,其他的目前用不到,像摄像头、打印机等的。
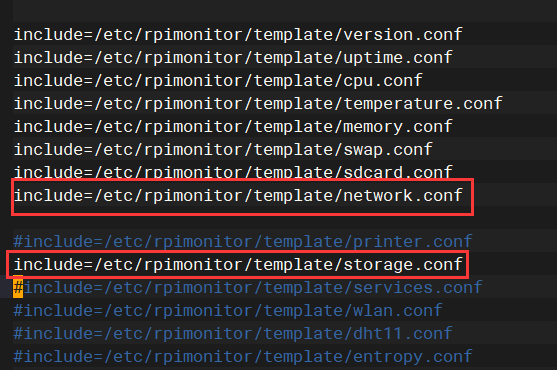
编辑 data.conf 文件
vi /etc/rpimonitor/data.conf
去掉最下面相应的注释。
编辑对应的文件,下面是我的。
network.conf,只是放开的注释。
########################################################################
# Extract Network information
#  Page: 1
#  Information               Status     Statistics
#  - recieved                - yes      - yes
#  - send                    - yes      - yes
#
# Note: Replace 'eth0' in the configuration bellow by the name of your
#       network interface and uncomment the line according to your needs
########################################################################

dynamic.10.name=net_received
dynamic.10.source=/sys/class/net/eth0/statistics/rx_bytes
dynamic.10.regexp=(.*)
dynamic.10.postprocess=$1*-1
dynamic.10.rrd=DERIVE
dynamic.10.max=0

dynamic.11.name=net_send
dynamic.11.source=/sys/class/net/eth0/statistics/tx_bytes
dynamic.11.regexp=(.*)
dynamic.11.postprocess=
dynamic.11.rrd=DERIVE
dynamic.11.min=0

web.status.1.content.8.name=Network
web.status.1.content.8.icon=network.png
#web.status.1.content.8.line.1="To activate network monitoring, edit and customize <font color='#AA0000'><b>network.conf</b></font>"
#web.status.1.content.8.line.2="Help is available in man pages:"
#web.status.1.content.8.line.3="<font color='#AA0000'><b>man rpimonitord</b></font> or <font color='#AA0000'><b>man rpimonitord.conf</b></font>"
web.status.1.content.8.line.1="Ethernet Sent: <b>"+KMG(data.net_send)+"<i class='icon-arrow-up'></i></b> Received: <b>"+KMG(Math.abs(data.net_received)) + "<i class='icon-arrow-down'></i></b>"

web.statistics.1.content.2.name=Network
web.statistics.1.content.2.graph.1=net_send
web.statistics.1.content.2.graph.2=net_received
web.statistics.1.content.2.graph_options.yaxis={ tickFormatter: function (v) { if (Math.abs(v) > 1048576) return (Math.round(v*10/1024/1024)/10) + " MiB/s" ; if (Math.abs(v) > 1024) return (Math.round(v*10/1024)/10) + " KiB/s" ; else return v + " B/s" }, }
web.statistics.1.content.2.ds_graph_options.net_send.label=Upload bandwidth (bytes)
web.statistics.1.content.2.ds_graph_options.net_send.lines={ fill: true }
web.statistics.1.content.2.ds_graph_options.net_send.color="#FF7777"
web.statistics.1.content.2.ds_graph_options.net_received.label=Download bandwidth (bytes)
web.statistics.1.content.2.ds_graph_options.net_received.lines={ fill: true }
web.statistics.1.content.2.7ds_graph_options.net_received.color="#77FF77"
storage.conf,注意你的硬盘格式ext4,还有盘符 sda1
########################################################################
# Extract Storage (1-sda1, 2-sda3) information
#  Page: 1
#  Information               Status     Statistics
#  - storage1 total          - yes      - yes
#  - storage1 used           - yes      - yes
#  - storage2 total          - yes      - yes
#  - storage2 used           - yes      - yes
########################################################################
static.10.name=storage1_total
static.10.source=df -t ext4
static.10.regexp=sda1\s+(\d+)
static.10.postprocess=$1/1024

#static.11.name=storage2_total
#static.11.source=df -t ext4
#static.11.regexp=sda3\s+(\d+)
#static.11.postprocess=$1/1024

dynamic.14.name=storage1_used
dynamic.14.source=df -t ext4
dynamic.14.regexp=sda1\s+\d+\s+(\d+)
dynamic.14.postprocess=$1/1024
dynamic.14.rrd=GAUGE

#dynamic.15.name=storage2_used
#dynamic.15.source=df -t ext4
#dynamic.15.regexp=sda3\s+\d+\s+(\d+)
#dynamic.15.postprocess=$1/1024
#dynamic.15.rrd=GAUGE

web.status.1.content.9.name=Storage
web.status.1.content.9.icon=usb_hdd.png
web.status.1.content.9.line.1="<b>/storage1</b> Used: <b>"+KMG(data.storage1_used,'M')+"</b> (<b>"+Percent(data.storage1_used,data.storage1_total,'M')+"</b>) Free: <b>"+KMG(data.storage1_total-data.storage1_used,'M')+ "</b> Total: <b>"+ KMG(data.storage1_total,'M') +"</b>"
web.status.1.content.9.line.2=ProgressBar(data.storage1_used,data.storage1_total)
#web.status.1.content.9.line.3="<b>/storage2</b> Used: <b>"+KMG(data.storage2_used,'M')+"</b> (<b>"+Percent(data.storage2_used,data.storage2_total,'M')+"</b>) Free: <b>"+KMG(data.storage2_total-data.storage2_used,'M')+ "</b> Total: <b>"+ KMG(data.storage2_total,'M') +"</b>"
#web.status.1.content.9.line.4=ProgressBar(data.storage2_used,data.storage2_total)

web.statistics.1.content.9.name=Storage1
web.statistics.1.content.9.graph.1=storage1_total
web.statistics.1.content.9.graph.2=storage1_used
web.statistics.1.content.9.ds_graph_options.storage1_total.label=Storage1 total space (MB)
web.statistics.1.content.9.ds_graph_options.storage1_total.color="#FF7777"
web.statistics.1.content.9.ds_graph_options.storage1_used.label=Storage1 used space (MB)
web.statistics.1.content.9.ds_graph_options.storage1_used.lines={ fill: true }
web.statistics.1.content.9.ds_graph_options.storage1_used.color="#7777FF"

#web.statistics.1.content.10.name=Storage2
#web.statistics.1.content.10.graph.1=storage2_total
#web.statistics.1.content.10.graph.2=storage2_used
#web.statistics.1.content.10.ds_graph_options.storage2_total.label=Storage2 total space (MB)
#web.statistics.1.content.10.ds_graph_options.storage2_total.color="#FF7777"
#web.statistics.1.content.10.ds_graph_options.storage2_used.label=Storage2 used space (MB)
#web.statistics.1.content.10.ds_graph_options.storage2_used.lines={ fill: true }
#web.statistics.1.content.10.ds_graph_options.storage2_used.color="#7777FF"
最后重启下服务
systemctl restart rpimonitor.service
最后效果如下:
四、总结
没啥总结的,链接到你的Heimdall里面,用起来吧。
收工!